

Portable electronic measuring instruments have been indispensable in capturing compressed air system baselines over the past number of years. Rarely are there enough permanent instruments installed at a typical industrial plant to use to get a clear picture of how well the compressors and dryers are operating. Very often, all a compressed air auditor finds when reviewing system instrumentation is analog pressure instruments and various readings that are made available on the air compressor and dryer control panels.
Getting a complete and thorough picture of a compressed air operating profile requires time-based measurements — taken at a high enough frequency — to capture a true representation of important system variables. These readings typically include:
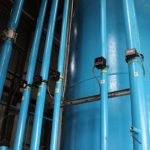
- Pressure readings at various points in the system to assess pressure gradients and the state of the system pressure control.
- Power measurements of the compressors and air dryers (sometimes derived from amp readings) to assess how efficiently compressed air equipment is meeting the needs of the plant — and to calculate the cost of system operation.
- Flow measurements to be used in relating the observed pressure and power to the actual flow demanded by the plant.
- Dew point of the compressed air as it exits the air dryer, to determine if the production meets the requested quality
- Temperature of the ambient environment, as very often excess heat is the cause of compressed air reliability and air quality problems.
The instruments are placed on all significant compressed air system compressors (and sometimes air dryers) and a baseline operating profile is captured, showing how the relevant variables in a system change with time within a measurement period. The measurement period is selected so that it captures all the possible variations in the facility demand profile, often taken over a seven-day period or some repeating duration (sometimes a month).
Once the sampling period is over, the auditor usually downloads the captured data stream and plots it for viewing. The data is typically analyzed with all the relevant variables displayed on the same time base. This is a very powerful way to assess how compressed air systems are operating. Each parameter is compared and assessed by an experienced auditor and viewed in relation to the system as a whole; this analysis of the data often finds various common problems.
An example of common findings is as per the attached graphic. We can see that the pressure in this facility is highly variable, during some of the measurement period the pressure is too high, causing the compressors to consume more power than desired. And at higher than needed pressure, all unregulated compressed air demand will consume more flow, causing additional power consumption as the compressors adjust to feed this extra “artificial demand.”

Further to this, by examining the pressure profile, an auditor might find low pressure events that may cause problems with production machinery. Very often, the plant compressor operators have no idea that these events are happening because they don’t have adequate permanent instrumentation installed.
If flow and compressor power are captured by data logging equipment, the reviewer can see what is causing the anomalies. These could be caused by demand exceeding the capacity of the compressors, excessive pressure drops across components and piping, or even problems with the compressor control. Because adequate data is available, it is a simple exercise to determine the cause. And once the cause is known, a plan for improvement can be made.
Be sure to have your system measured to ensure your compressed air system is meeting your needs.

Leave a Reply